A few weeks ago, we’ve seen Apple announce their newest iPhone 13 series devices, a set of phones being powered by the newest Apple A15 SoC. Today, in advance of the full device review which we’ll cover in the near future, we’re taking a closer look at the new generation chipset, looking at what exactly Apple has changed in the new silicon, and whether it lives up to the hype.
This year’s announcement of the A15 was a bit odder on Apple’s PR side of things, notably because the company generally avoided making any generational comparisons between the new design to Apple’s own A14. Particularly notable was the fact that Apple preferred to describe the SoC in context of the competition; while that’s not unusual on the Mac side of things, it was something that this year stood out more than usual for the iPhone announcement.
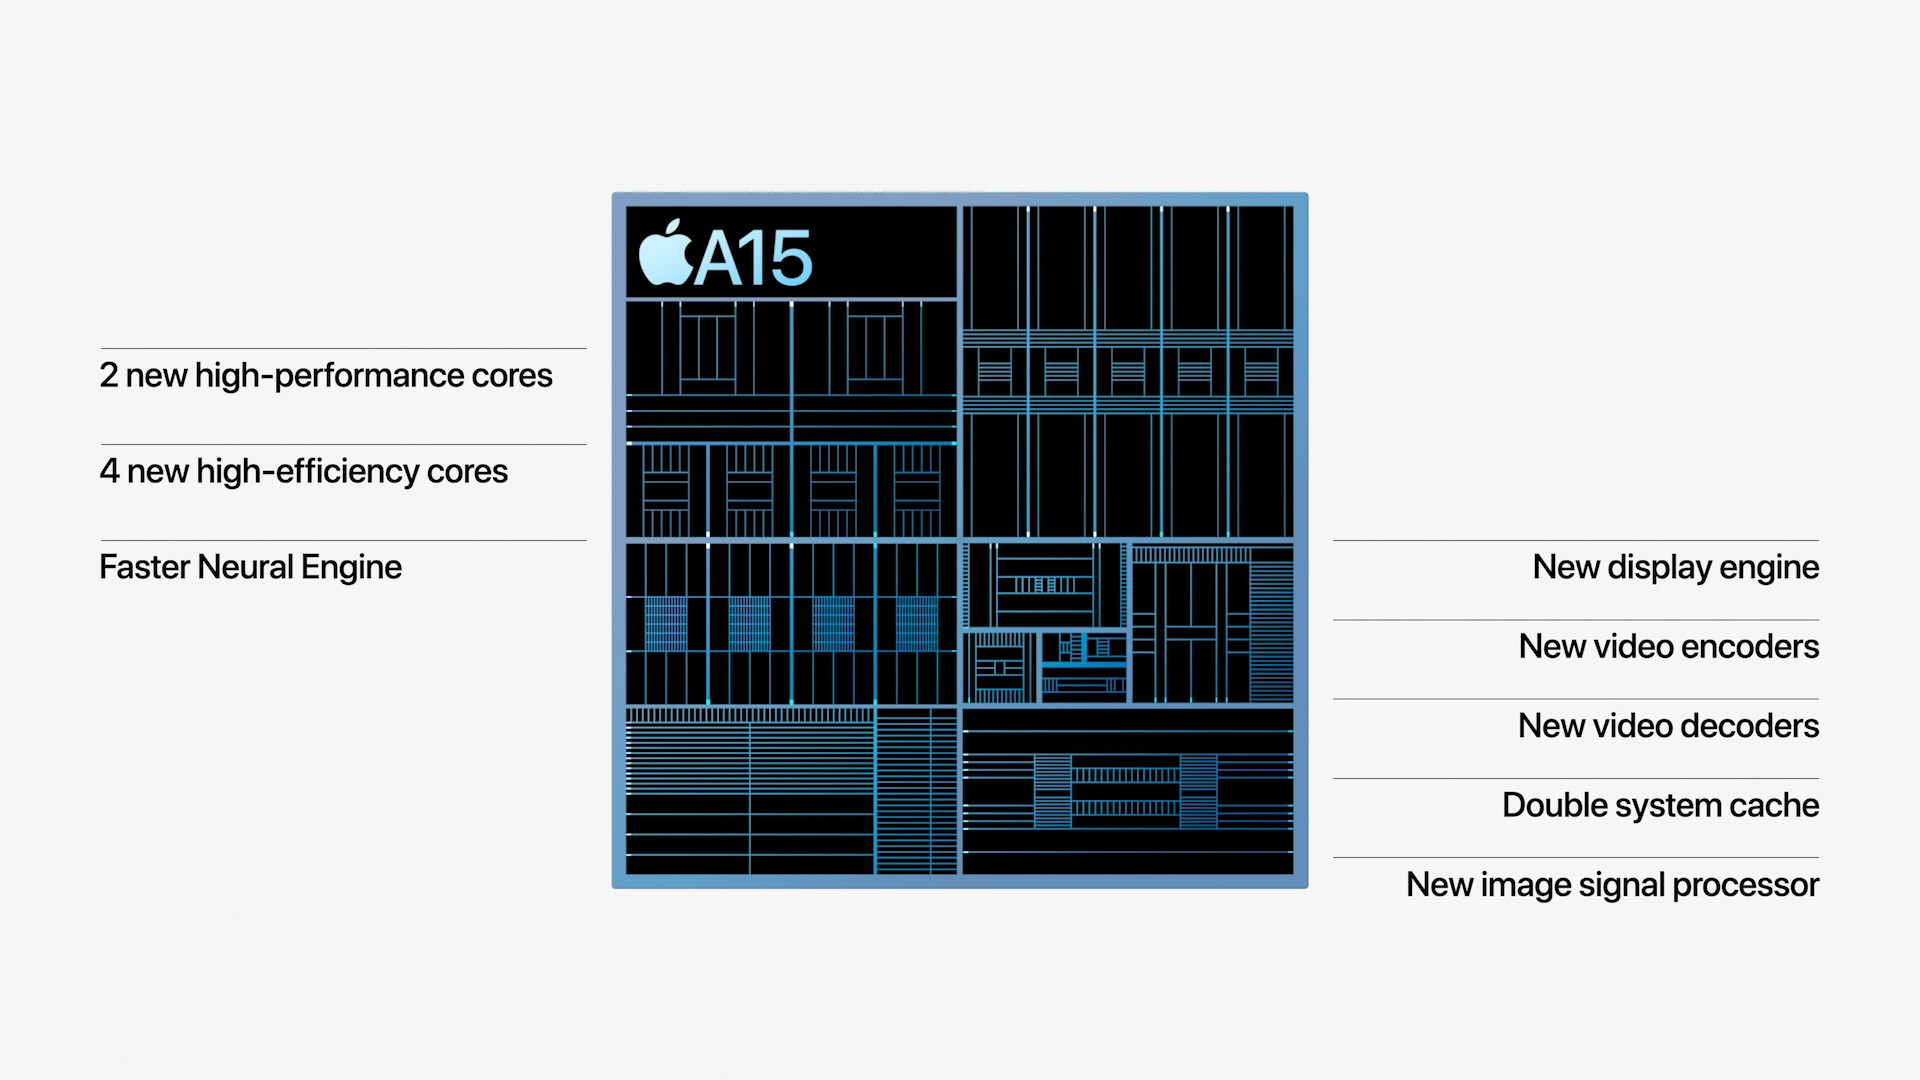
The few concrete factoids about the A15 were that Apple is using new designs for their CPUs, a faster Neural engine, a new 4- or 5-core GPU depending on the iPhone variant, and a whole new display pipeline and media hardware block for video encoding and decoding, alongside new ISP improvements for camera quality advancements.
On the CPU side of things, improvements were very vague in that Apple quoted to be 50% faster than the competition, and the GPU performance metrics were also made in such a manner, describing the 4-core GPU A15 being +30% faster than the competition, and the 5-core variant being +50% faster. We’ve put the SoC through its initial paces, and in today’s article we’ll be focusing on the exact performance and efficiency metrics of the new chip.
Frequency Boosts; 3.24GHz Performance & 2.0GHz Efficiency Cores
Starting off with the CPU side of things, the new A15 is said to feature two new CPU microarchitectures, both for the performance cores as well as the efficiency cores. The first few reports about the performance of the new cores were focused around the frequencies, which we can now confirm in our measurements:
| Maximum Frequency vs Loaded Threads Per-Core Maximum MHz |
||||||
| Apple A15 | 1 | 2 | 3 | 4 | ||
| Performance 1 | 3240 | 3180 | ||||
| Performance 2 | 3180 | |||||
| Efficiency 1 | 2016 | 2016 | 2016 | 2016 | ||
| Efficiency 2 | 2016 | 2016 | 2016 | |||
| Efficiency 3 | 2016 | 2016 | ||||
| Efficiency 4 | 2016 | |||||
| Maximum Frequency vs Loaded Threads Per-Core Maximum MHz |
||||||
| Apple A14 | 1 | 2 | 3 | 4 | ||
| Performance 1 | 2998 | 2890 | ||||
| Performance 2 | 2890 | |||||
| Efficiency 1 | 1823 | 1823 | 1823 | 1823 | ||
| Efficiency 2 | 1823 | 1823 | 1823 | |||
| Efficiency 3 | 1823 | 1823 | ||||
| Efficiency 4 | 1823 | |||||
Compared to the A14, the new A15 increases the peak single-core frequency of the two-performance core cluster by 8%, now reaching up to 3240MHz compared to the 2998MHz of the previous generation. When both performance cores are active, their operating frequency actually goes up by 10%, both now running at an aggressive 3180MHz compared to the previous generation’s 2890MHz.
In general, Apple’s frequency increases here are quite aggressive given the fact that it’s quite hard to push this performance aspect of a design, especially when we’re not expecting major performance gains on the part of the new process node. The A15 should be made on an N5P node variant from TSMC, although neither company really discloses the exact details of the design. TSMC claims a +5% frequency increase over N5, so for Apple to have gone further beyond this would have indicated an increase in power consumption, something to keep in mind of when we dive deeper into the power characteristics of the CPUs.
The E-cores of the A15 are now able to clock up to 2016MHz, a 10.5% increase over the A14’s cores. The frequency here is independent of the performance cores, as in the number of threads in the cluster doesn’t affect the other cluster, or vice-versa. Apple has done some more interesting changes to the little cores this generation, which we’ll come to in a bit.
Giant Caches: Performance CPU L2 to 12MB, SLC to Massive 32MB
One more straightforward technical detail Apple revealed during its launch was that the A15 now features double the system cache compared to the A14. Two years ago we had detailed the A13’s new SLC which had grown from 8MB in the A12 to 16MB, a size that was also kept constant in the A14 generation. Apple claiming they’ve doubled this would consequently mean it’s 32MB now in the A15.
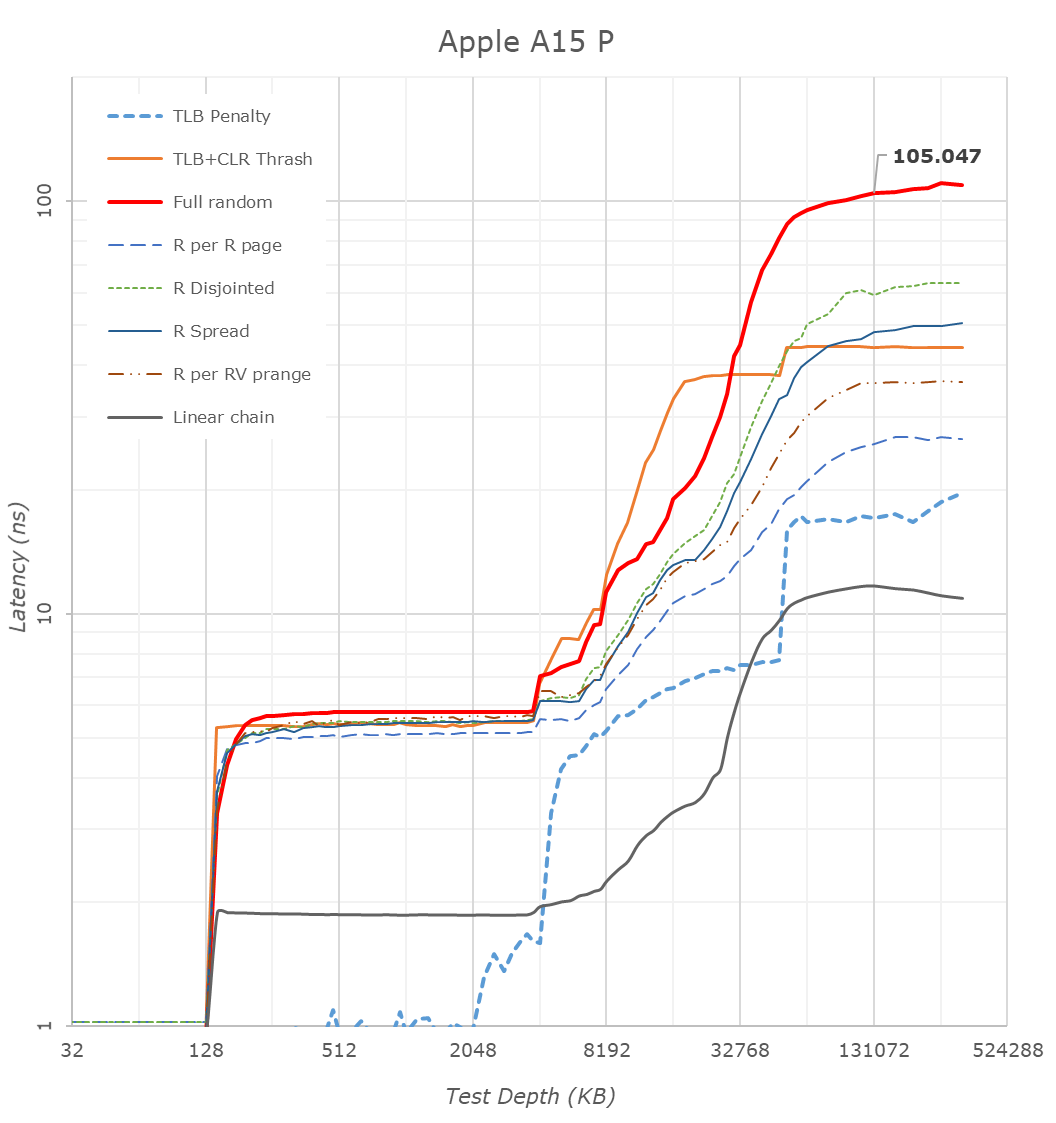
Looking at our latency tests on the new A15, we can indeed now confirm that the SLC has now doubled up to 32MB, further pushing the memory depth to reach DRAM. Apple’s SLC is likely to be a key factor in the power efficiency of the chip, being able to keep memory accesses on the same silicon rather than going out to slower, and more power inefficient DRAM. We’ve seen these types of last-level caches being employed by more SoC vendors, but at 32MB, the new A15 dwarfs the competition’s implementations, such as the 3MB SLC on the Snapdragon 888 or the estimated 6-8MB SLC on the Exynos 2100.
What Apple didn’t divulge, is also changes to the L2 cache of the performance cores, which has now grown by 50% from 8MB to 12MB. This was actually the same L2 size as on the Apple M1, only this time around it’s serving only two performance cores rather than four. The access latency appears to have risen from 16 cycles on the A14 to 18 cycles on the A15. On the performance cores I’m also seeing some changes in the L1 speeds as it seems to be able to make 1-cycle accesses to cache lines, as long as they’re in the same page, the same type of access on the A14 takes 3 cycles.
A 12MB L2 is again humongous, over double compared to the combined L3+L2 (4+1+3x0.5 = 6.5MB) of other designs such as the Snapdragon 888. It very much appears Apple has invested a lot of SRAM into this year’s SoC generation.
The efficiency cores this year don’t seem to have changed their cache sizes, remaining at 64KB L1D’s and 4MB shared L2’s, however we see Apple has increased the L2 TLB to 2048 entries, now covering up to 32MB, likely to facilitate better SLC access latencies. Interestingly, Apple this year now allows the efficiency cores to have faster DRAM access, with latencies now at around 130ns versus the +215ns on the A14, again something to keep in mind of in the next performance section of the article.
CPU Microarchitecture Changes: A Slow(er) Year?
This year’s CPU microarchitectures were a bit of a wildcard. Earlier this year, Arm had announced the new Armv9 ISA, predominantly defined by the new SVE2 SIMD instruction set, as well as the company’s new Cortex series CPU IP which employs the new architecture. Back in 2013, Apple was notorious for being the first on the market with an Armv8 CPU, the first 64-bit capable mobile design. Given that context, I had generally expected this year’s generation to introduce v9 as well, but however that doesn’t seem to be the case for the A15.
Microarchitecturally, the new performance cores on the A15 doesn’t seem to differ much from last year’s designs. I haven’t invested the time yet to look at every nook and cranny of the design, but at least the back-end of the processor is identical in throughput and latencies compared to the A14 performance cores.
The efficiency cores have had more changes, alongside some of the memory subsystem TLB changes, the new E-core now gains an extra integer ALU, bringing the total up to 4, up from the previous 3. The core for some time no longer could be called “little” by any means, and it seems to have grown even more this year, again, something we’ll showcase in the performance section.
The possible reason for Apple’s more moderate micro-architectural changes this year might be a storm of a few factors – Apple had notably lost their lead architect on the big performance cores, as well as parts of the design teams, to Nuvia back in 2019 (later acquired by Qualcomm earlier this year). The shift towards Armv9 might also imply some more work done on the design, and the pandemic situation might also have contributed to some non-ideal execution. We’ll have to examine next year’s A16 to really determine if Apple’s design cadence has slowed down, or whether this was merely just a slippage, or simply a lull before a much larger change in the next microarchitecture.
Of course, the tone here paints rather conservative improvement of the A15’s CPUs, which when looking at performance and efficiency, are anything but that.
Starting off with this year’s review of the A15, in order to have a deeper look at the CPU single-threaded performance and power efficiency, we’re migrating over to SPEC CPU 2017. While 2006 has served us well over the years and is still important and valid, 2017 is now better understood in terms of its microarchitectural aspects in its components, and becoming more relevant as we moved our desktop side coverage to the new suite some time ago.
One continuing issue with SPEC CPU 2017 is the Fortran subtests; due to a lacking compiler infrastructure both on iOS and Android, we’re skipping these components entirely for mobile devices. What this means also, is that the total aggregate scores presented here are not comparable to the full suite scores on other platforms, denoted by the (C/C++) subscript in the score descriptions.
As always, because we’re running completely custom harnesses and not submitting the scores officially to SPEC, we have to denote the results as “estimates”, although we have high confidence in the accuracy.
In terms of compiler settings, we’re continuing to employ simple -Ofast flags without further changes, to be able to get the best cross-platform comparisons possible. On the iOS side of things, we’re running on the newest XCode 13 build tools, while on Android we’re running the NDKr23 build tools.
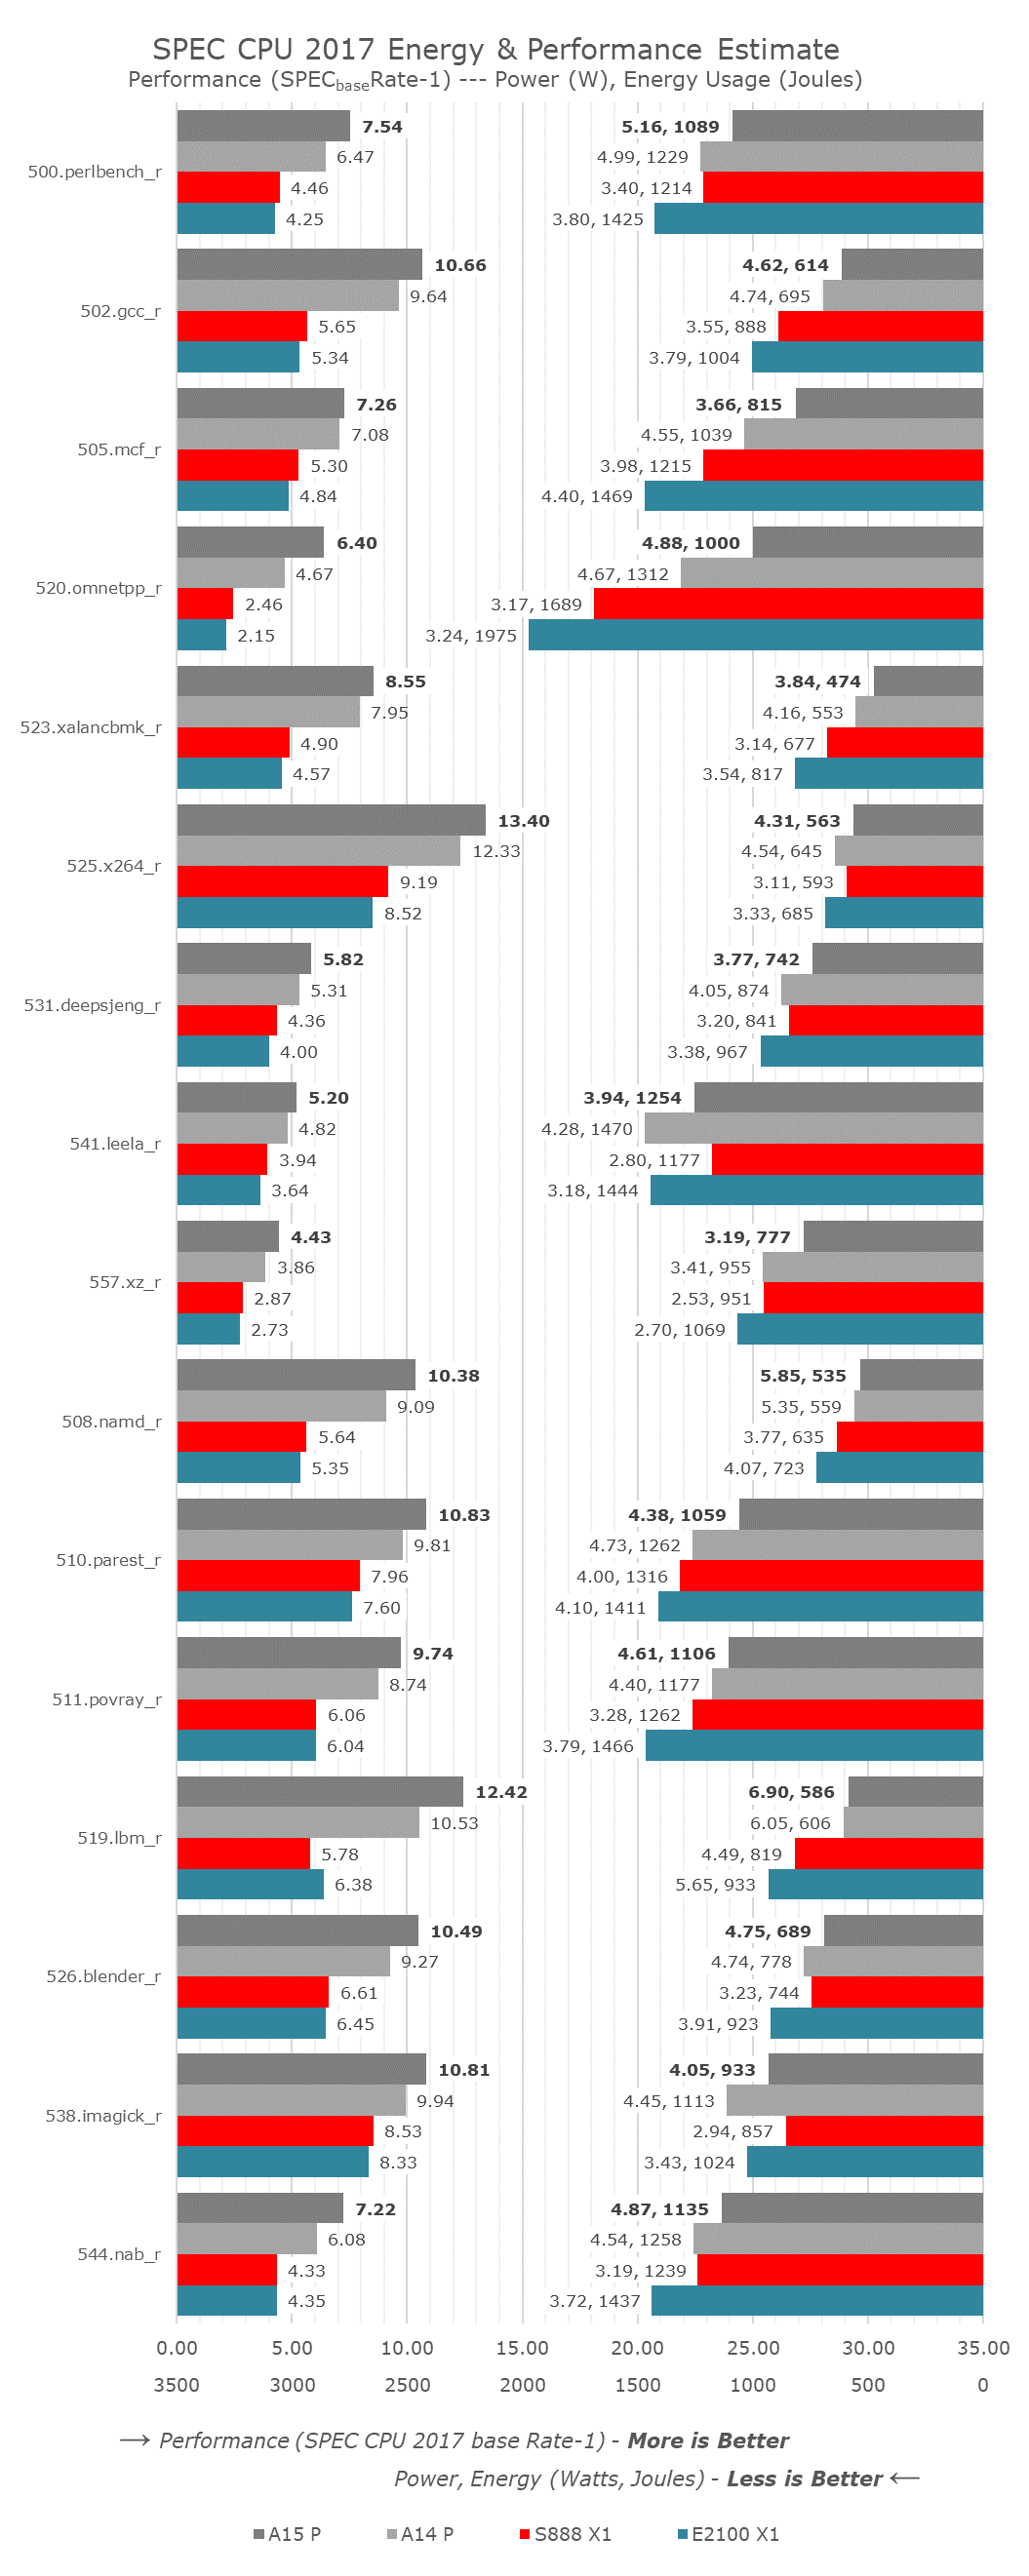
In terms of performance and efficiency details, we’re swapping the graphs around a bit from now on – on the left axis we have the performance scores of the tests – larger bars here mean better performance. On the right-side axis, growing from right to left are the energy consumption figures for the platforms, the smaller the figure, the more energy efficient (less energy consumed) a workload was completed. Alongside the energy figure in Joules, we’re also showcasing the average power figure in Watts.
Starting off with the performance figures of the A15, we’re seeing increases across the board, with absolute performance going up from a low of 2.5% to a peak of +37%.
The lowest performance increases were found in 505.mcf_r, a more memory latency sensitive workload; given the increased L2 latency as well as slightly higher DRAM latency, it doesn’t come too unexpected to see a more minor performance increase. However, when looking at the power and efficiency metrics of the same workload, we see the A15 use up almost 900mW less than the A14, with energy efficiency improving by +22%. 520.omnetpp_r saw the biggest individual increase at +37% performance – power here went up a bit, but energy efficiency is also up 24%.
The smallest performance gains of the A15 are found in the most back-end execution bound workloads, 525.x264_r and 538.imagick_r improve by only 8.7%, resulting in an IPC increase of 0.6% - essentially within the realm of measurement noise. Still, even here in this worst performance case, Apple still managed to improve energy efficiency by +13%, as the new chip is using less absolute power even though clock frequencies have gone up.
The most power demanding workload, 519.lbm_r, is extremely bandwidth hungry and stresses the DRAM the most in the suite, with the A15 chip here eating a whopping 6.9W of power. Still, energy efficiency is generationally slightly improved as performance goes up by 17.9% - based on first teardown reports, the A15 is still only powered by LPDDR4X-class memory, so these improvements must be due to the chip’s new memory subsystem and new SLC.
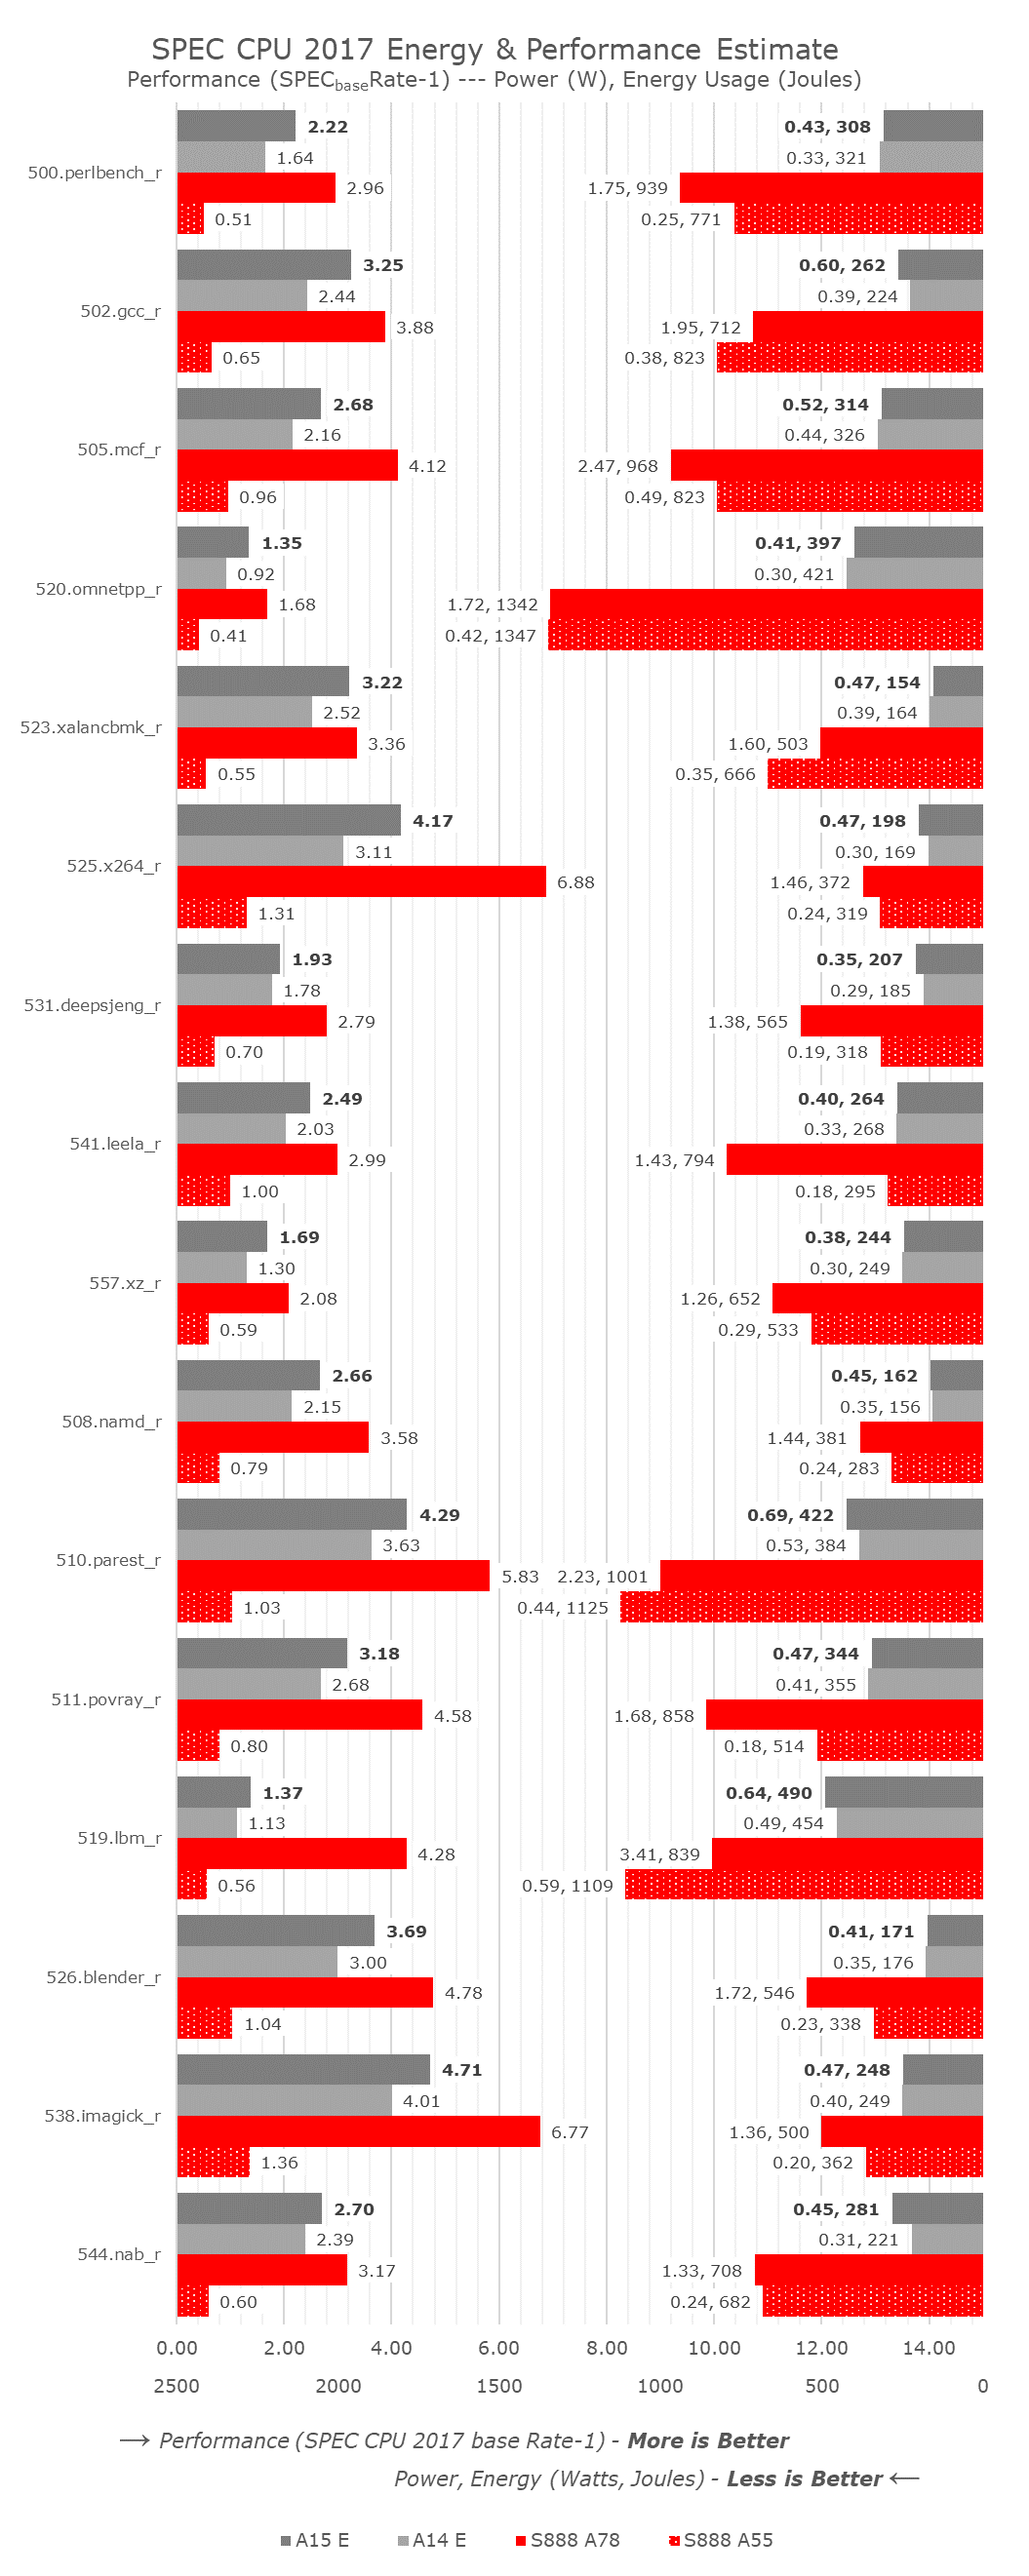
Shifting things over to the efficiency cores, I wanted to make comparisons not only to the A14’s E-cores, but also put the Apple chips in context to the competition, a Snapdragon 888 in this context, comparing against a 2.41GHz Cortex-A78 mid-core, as well as a 1.8GHz Cortex-A55 little core.
The A15’s E-cores are extremely impressive when it comes to performance. The minimum improvement varies from +8.4 in the 531.deepsjeng_r, essentially flat up with clocks, to up to again +46% in 520.omnetpp_r, putting more evidence into some sort of large effective sparse memory access parallelism improvement for the chip. The core has a median performance improvement of +23%, resulting in a median IPC increase of +11.6%. The cores here don’t showcase the same energy efficiency improvement as the new A15’s performance cores, as energy consumption is mostly flat due to performance increases coming at a cost of power increases, which are still very much low.
Compared to the Snapdragon 888, there’s quite a stark juxtaposition. First of all, Apple’s E-cores, although not quite as powerful as a middle core on Android SoCs, is still quite respectable and does somewhat come close to at least view them in a similar performance class. The comparison against the little Cortex-A55 cores is more absurd though, as the A15’s E-core is 3.5x faster on average, yet only consuming 32% more power, so energy efficiency is 60% better. Even for the middle cores, if we possibly were to down-clock them to match the A15’s E-core’s performance, the energy efficiency is multiple factors off what Apple is achieving.
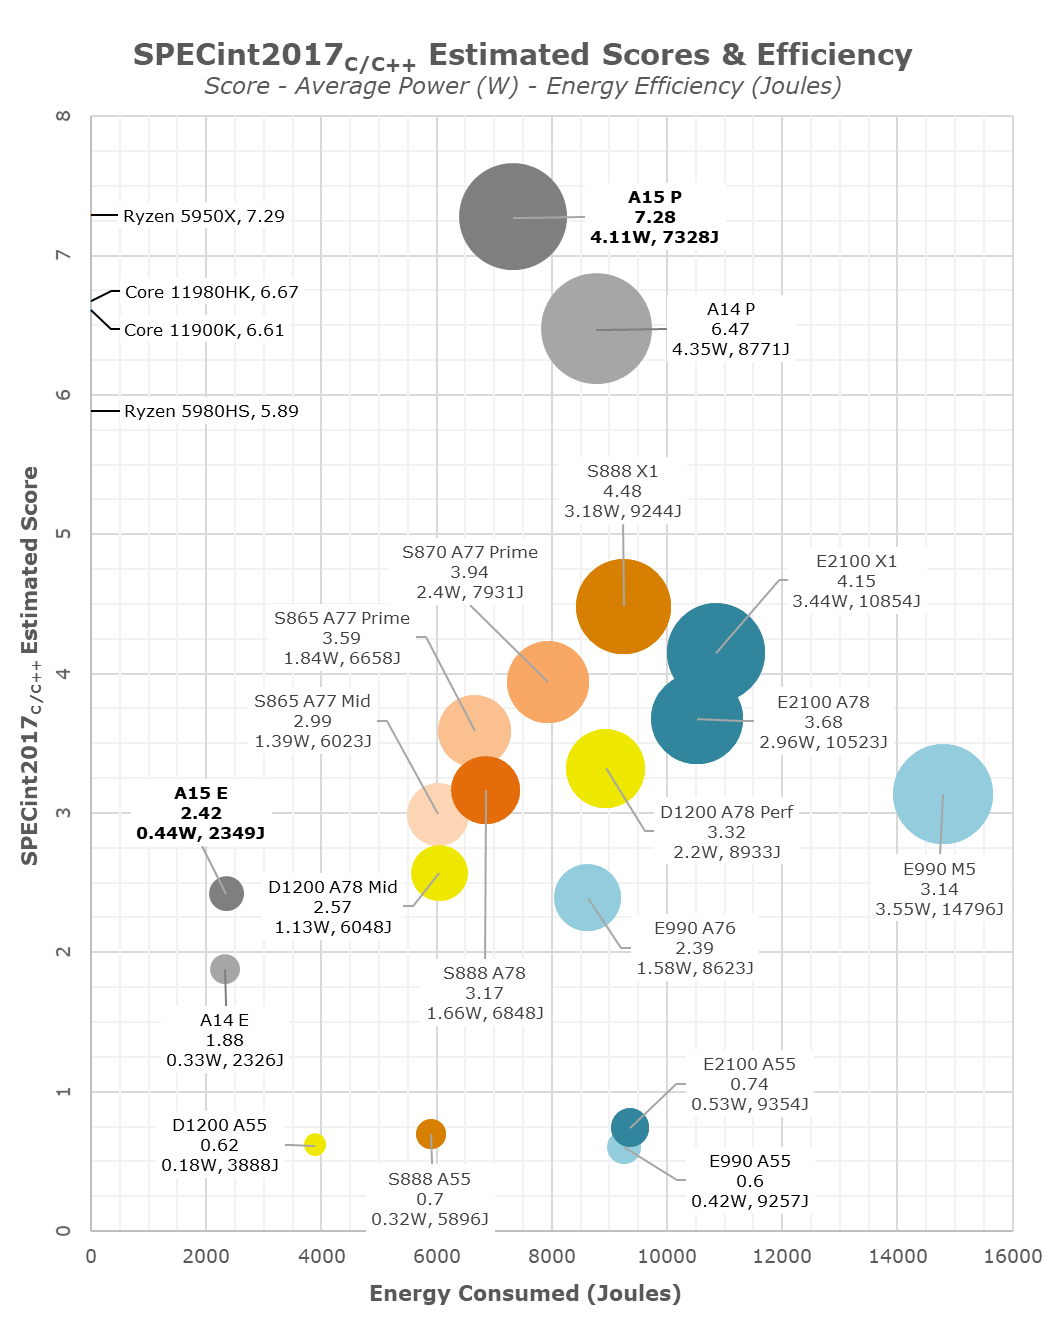
In the overview graph, I’m also changing things a bit, and moving to bubble charts to better spatially represent the performance to energy efficiency positioning, as well as the performance to power positioning. In the energy axis graphs, which I personally find to be more representative of the comparative efficiency and resulting battery life experiences of the SoCs, we see the various SoCs at their peak CPU performance states versus the total energy consumed to complete the workloads. On the power axis graphs, we see the same data, only plotted against average power. Generally, I find distinction of efficiency here to be quite harder between the various data-points, however some readers have requested this view. The bubble size corresponds to the average power of the various CPUs, we’re measuring system active power, meaning total device workload power minus idle power, to compensate components such as the display.
Apple A15 performance cores are extremely impressive here – usually increases in performance always come with some sort of deficit in efficiency, or at least flat efficiency. Apple here instead has managed to reduce power whilst increasing performance, meaning energy efficiency is improved by 17% on the peak performance states versus the A14. If we had been able to measure both SoCs at the same performance level, this efficiency advantage of the A15 would grow even larger. In our initial coverage of Apple’s announcement, we theorised that the company might possibly invested into energy efficiency rather than performance increases this year, and I’m glad to see that seemingly this is exactly what has happened, explaining some of the more conservative (at least for Apple) performance improvements.
On an adjacent note, with a score of 7.28 in the integer suite, Apple’s A15 P-core is on equal footing with AMD’s Zen3-based Ryzen 5950X with a score of 7.29, and ahead of M1 with a score of 6.66.
The A15’s efficiency cores are also massively impressive – at peak performance, efficiency is flat, but they’re also +28% faster. Again, if we would be able to compare both SoCs at the same performance level, the efficiency advantage of the A15’s E-cores would be very obvious. The much better performance of the E-cores also massively helps avoiding the P-cores, further improving energy efficiency of the SoC.
Compared to the competition, the A15 isn’t +50 faster as Apple claims, but rather +62% faster. While Apple’s larger cores are more power hungry, they’re still a lot more energy efficient. Granted, we are seeing a process node disparity in favour of Apple. The performance and efficiency of the A15 E-cores also put to shame the rest of the pack. The extremely competent performance of the 4 efficiency cores alongside the leading performance of the 2 big cores explain the significantly better multi-threaded performance than the 1+3+4 setups of the competition.
Overall, the new A15 CPUs are substantial improvements, even though that’s not immediately noticeable to some. The efficiency gains are likely key to the new vastly longer battery longevity of the iPhone 13 series phones – more on that in a dedicated piece in a few days, and in our full device review.
The GPUs on the A15 iPhones are interesting, this is the first time that Apple has functionally segmented the GPU configurations on their SoCs within the iPhone device range, with the iPhone 13 mini and iPhone 13 receiving a 4-core GPU, similar to the A14 devices last year, while the 13 Pro and 13 Pro Max receive a 5-core variant of the SoC. It’s still the same SoC and silicon chip in both cases, just that Apple is disabling one GPU core on the non-Pro models, possibly for yield reasons?
Apple’s performance figures for the GPU were also a bit intriguing in that there weren’t any generational comparisons, just a “+30%” and “+50%” figure against the competition. I initially theorized to mean +10% and +28% against the A14, so let’s see if that pans out:
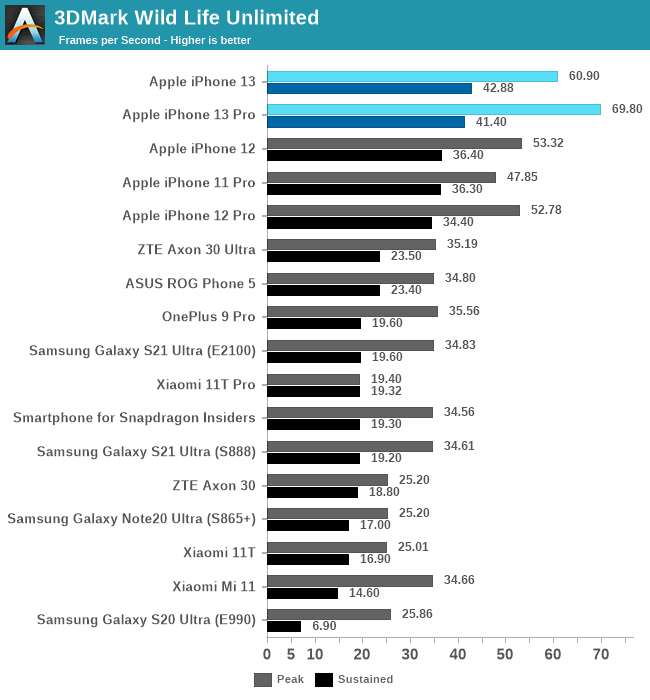
In the 3DMark Wild Life test, we see the 5-core A15 leap the A15 by +30%, while the 4-core showcases a +14% improvement, so quite close to what we predicted. The peak performance here is essentially double that of the nearest competitor, so Apple is likely low-balling things again.
In terms of sustained performance, the new chips continue to showcase a large difference in what they achieve with a cold phone versus a heated phone, interestingly, the 4-core iPhone 13 lands a bit ahead of the 13 Pro here, more on this later.
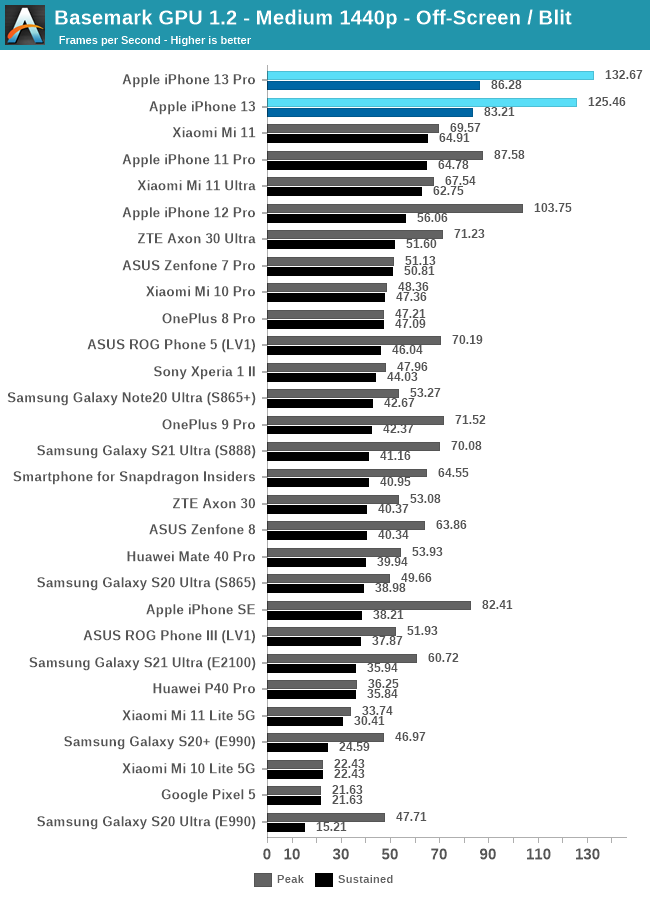
In Basemark GPU, the 13 Pro lands in at +28% over the 12 Pro, with the 4-core iPhone 13 only being slightly slower. Again, the phones throttle hard, however still manage to land with sustained performances well above the peak performances of the competition.
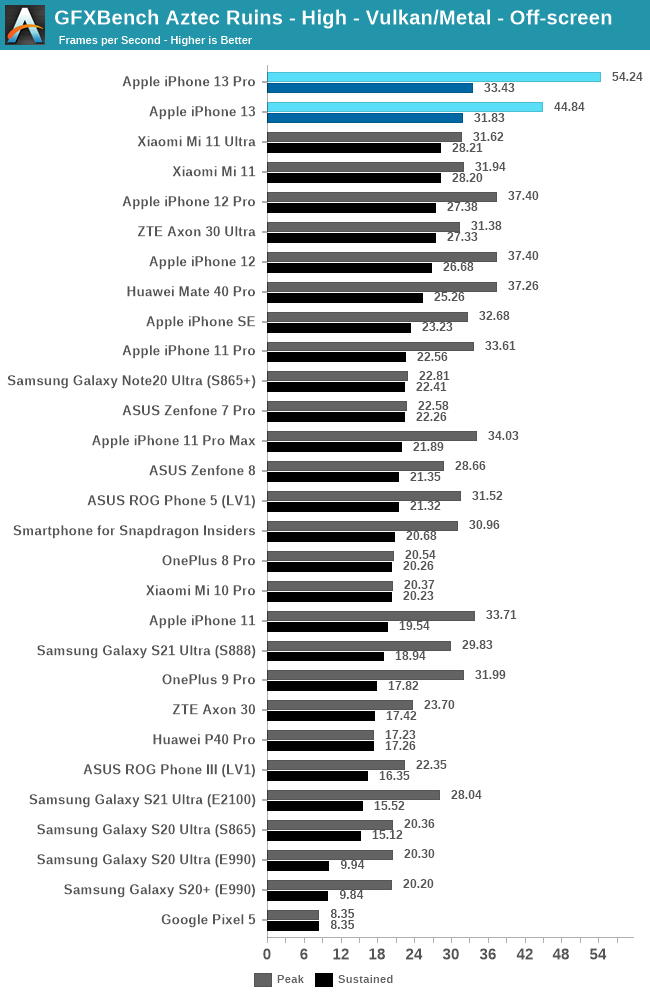
In GFXBench Aztec High, the 13 Pro lands in at a massive +46% performance advantage over the 12 Pro, while the 13 showcases a +19% boost. These are numbers that are above the expectations – in terms of microarchitectural changes the new A15 GPU appears to adopt the same double FP32 throughput as on the M1 GPU, seemingly adding extra units alongside the existing FP32/double-rate FP16 ALUs. The increased 32MB SLC will also likely help a lot with GPU bandwidth and hit-rates, so these two changes seem to be the most obvious explanations for the massive increases.
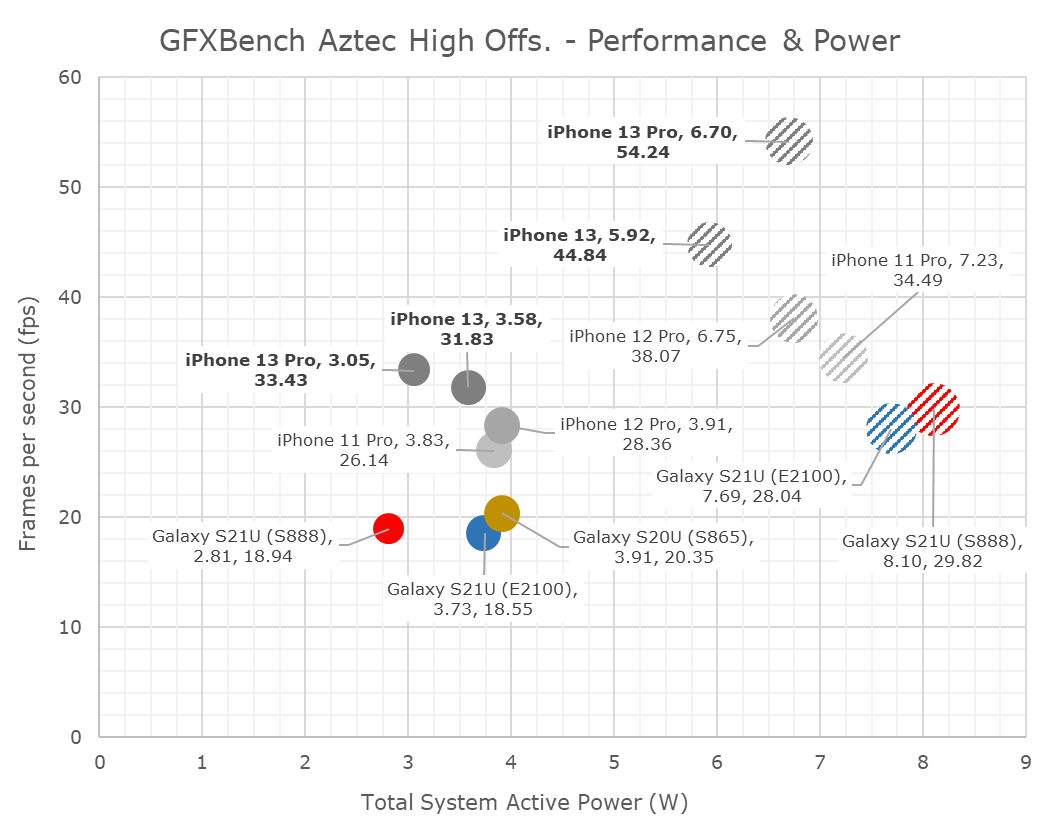
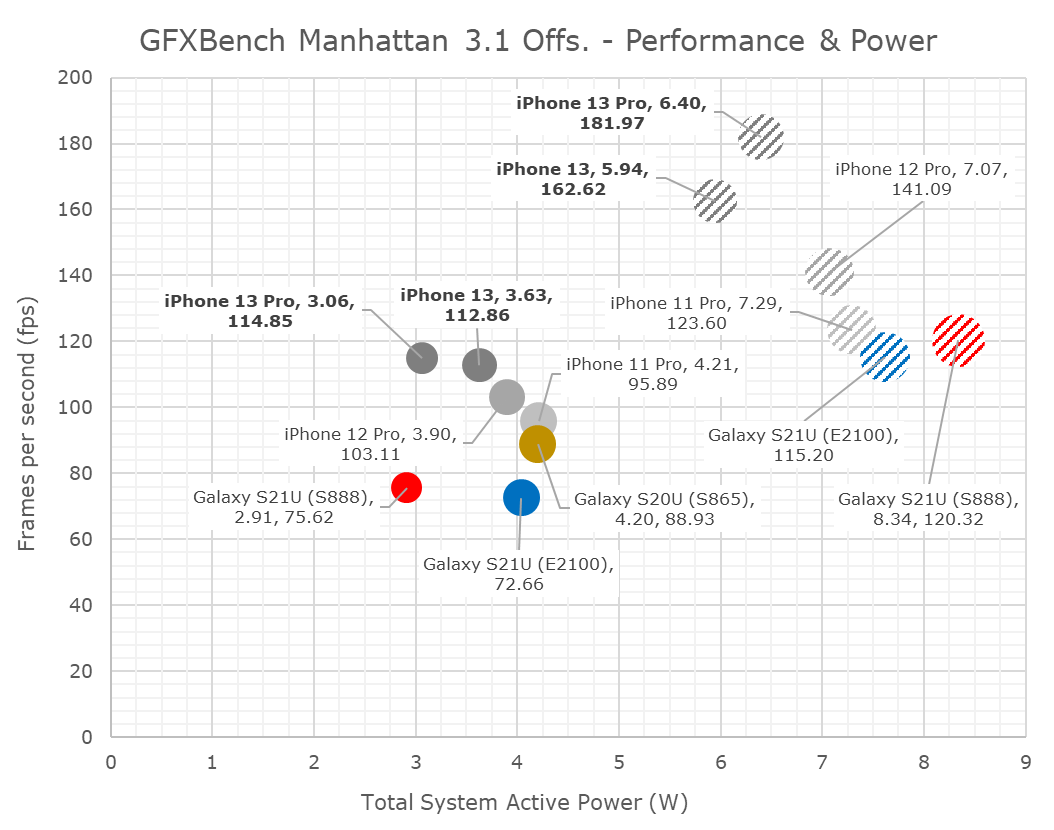
In terms of power and efficiency, I’m also migrating away from tables to bubble charts to better represent the spatial positioning of the various SoCs.
I’d also like to note here that I had went ahead and re-measured the A13 and A14 phones in their peak performance states, showcasing larger power figures than the ones we’ve published in the past. Reason for this is the methodology where we’re only able to measure via input power of the phone, as we cannot dismantle our samples and are lacking PMIC fuelgauge access otherwise. The iPhone 13 figures here are generally hopefully correct as I measured other scenarios up to 9W, however there is still a bit of doubt on whether the phone is drawing from battery or not. The sustained power figures have a higher reliability.
As noted, the A15’s peak performance is massively better, but also appearing that the phone is improving the power draw slightly compared to the A14, meaning we see large efficiency improvements.
Both the 13 and 13 Pro throttle quite quickly after a few minutes of load, but generally at different power points. The 13 Pro with its 5-core GPU throttles down to around 3W, while the 13 goes to around 3.6W.
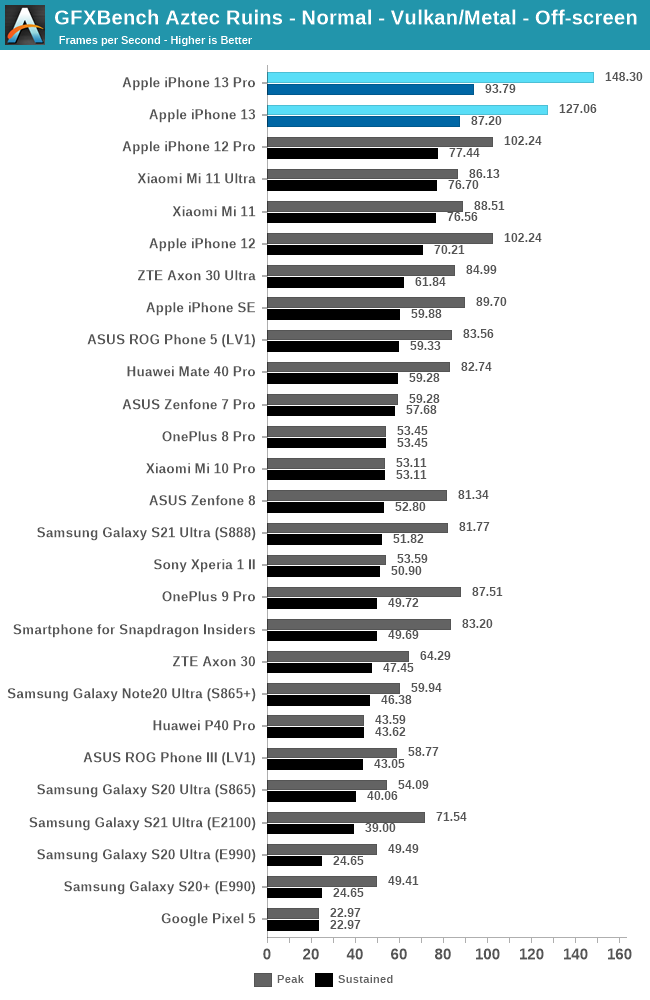
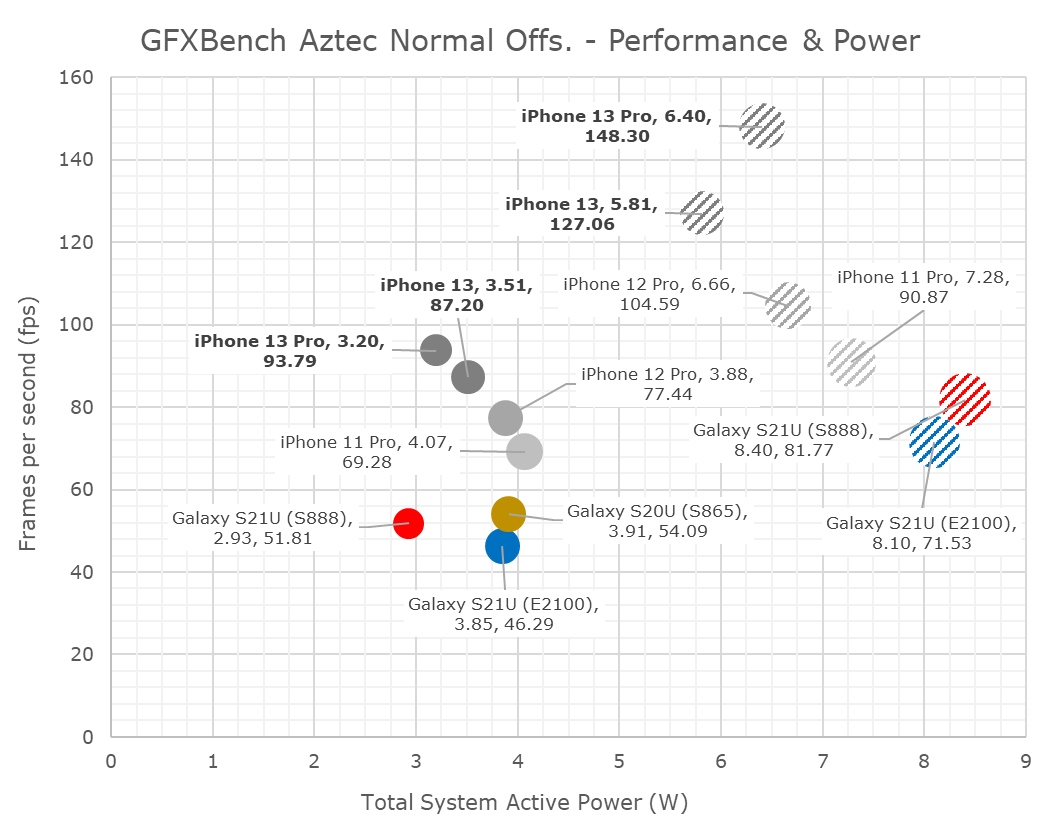
In Aztec Normal, we’re seeing similar relative positioning both in performance and efficiency. The iPhones 13 and 13 Pro are quite closer in performance than expected, due to different throttling levels.
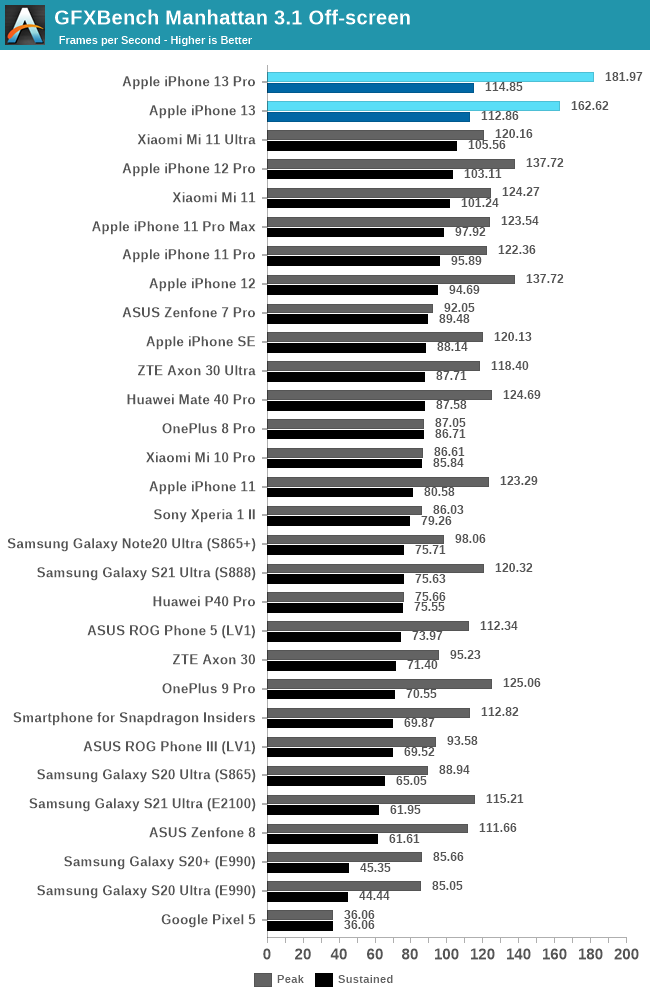
Finally, in Manhattan 3.1, the A15’s 5-core goes up +32%, while the 4-core goes up +18%. The sustained performance isn’t notably different between the two, and also represent smaller improvements over the iPhone 11 and 12 series.
Impressive GPU Performance, but quite limited thermals
Our results here showcase two sides of a coin: In terms of peak performance, the new A15 GPU is absolutely astonishing, and showcasing again improvements that are well above Apple’s marketing claims. The new GPU architecture, and possibly the new SLC allow for fantastic gains in performance, as well as efficiency.
What’s not so great, is the phone’s throttling. Particularly, we seem to be seeing quite reduced power levels on the iPhone 13 Pro, compared to the iPhone 13 as well as previous generation iPhones.
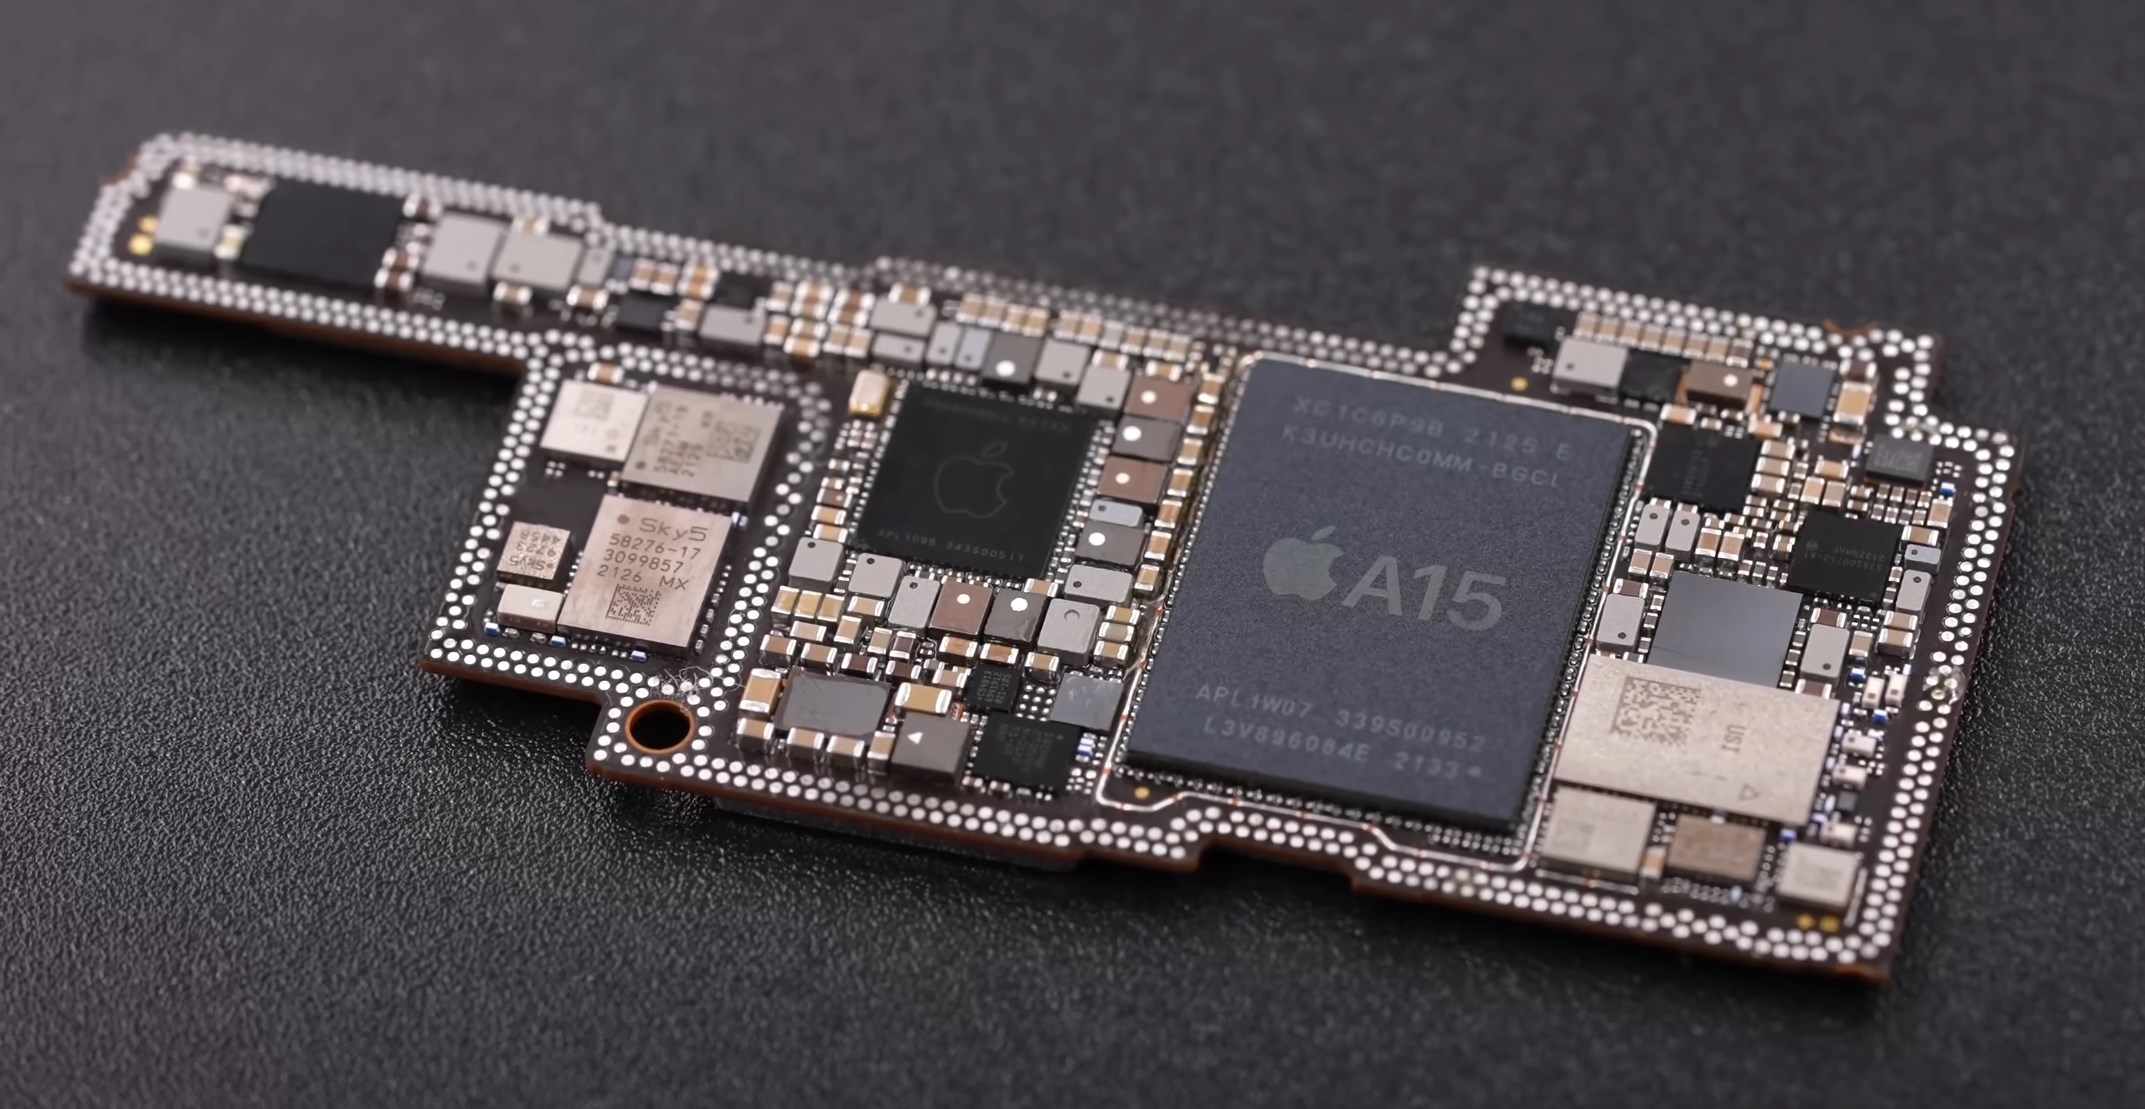
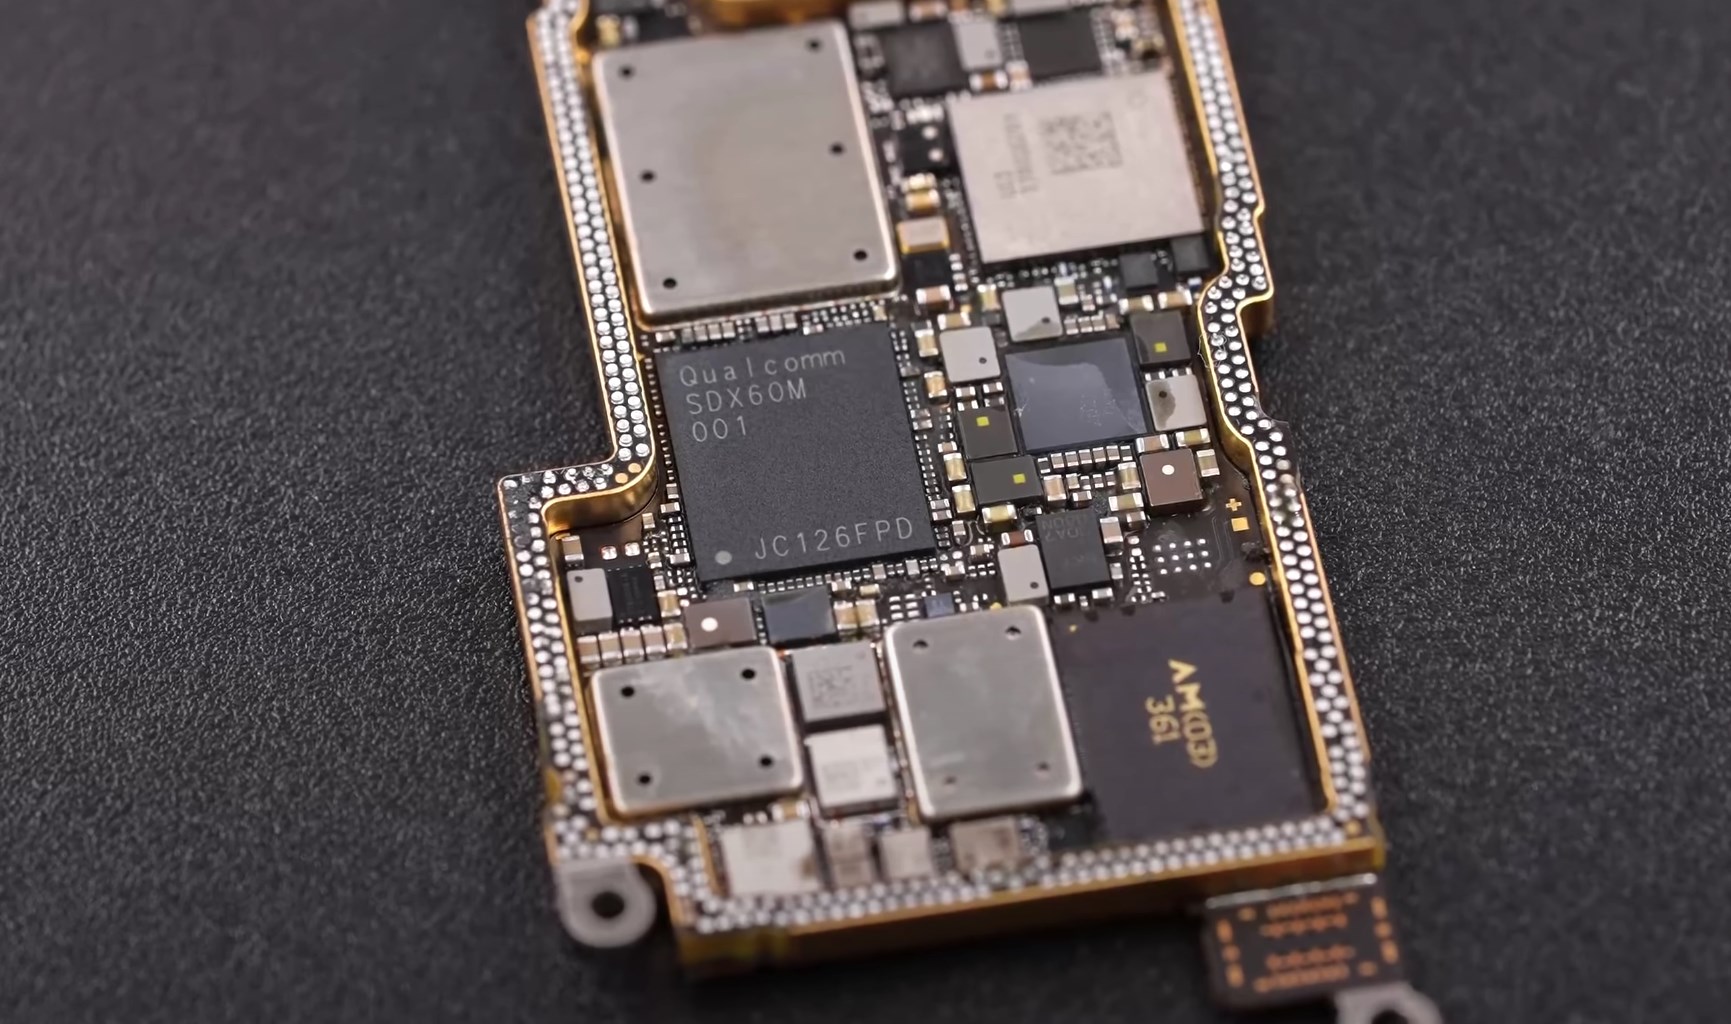
Source: 微机分WekiHome
The 13 Pro models this year come with a new PCB design, that’s even denser than what we’ve had on the previous generations, in order to facilitate the larger battery and new camera modules. What’s been extremely perplexing with Apple’s motherboard designs has been the fact that since they employed dual-layer “sandwich” PCBs, is that they’re packaging the SoC on the inside of the two soldered boards. This comes in contrast to other vendors such as Samsung, who also have adopted the “sandwich” PCB, but the SoC is located on the outer side of the assembly, making direct contact with the heat spreader and display mid-frame.
There are reports of the new iPhones throttling more under gaming and cellular connectivity – well, I’m sure that having the modem directly opposite the SoC inside the sandwich is a contributor to this situation. The iPhone 13 Pro showcasing lower sustained power levels may be tied to the new PCB design, and Apple’s overall iPhone thermal design is definitely amongst the worst out there, as it doesn’t do a good job of spreading the heat throughout the body of the phone, achieving a SoC thermal envelope that’s far smaller than the actual device thermal envelope.
No Apples to Apples in Gaming
In terms of general gaming performance, I’ll also want to make note of a few things – the new iPhones, even with their somewhat limited thermal capacity, are still vastly faster than give out a better gaming experience than competitive phones. Lately benchmarking actual games has been something that has risen in popularity, and generally, I’m all for that, however there are just some fundamental inconsistencies that make direct game comparisons not empirically viable to come to SoC conclusions.
Take Genshin Impact for example, unarguably the #1 AAA mobile game out there, and also one of the most performance demanding titles in the market right now, comparing the visual fidelity on a Galaxy S21 Ultra (Snapdragon 888), Mi 11 Ultra, and the iPhone 13 Pro Max:

Galaxy S21 Ultra - Snapdragon 888

Mi 11 Ultra - Snapdragon 888
Even though the S21 Ultra and the Mi 11 Ultra both feature the same SoC, they have very different characteristics in terms of thermals. The S21 Ultra generally sustains about 3.5W total device power under the same conditions, while the Mi 11 Ultra will hover between 5-6W, and a much hotter phone. The difference between the two not only exhibits itself in the performance of the game, but also in the visual fidelity, as the S21 Ultra is running much lower resolution due to the game having a dynamic resolution scaling (both phones had the exact same game settings).

iPhone 13 Pro Max - A15
The comparison between Android phones and iPhones gets even more complicated in that even with the same game setting, the iPhones still have slightly higher resolution, and visual effects that are just outright missing from the Android variant of the game. The visual fidelity of the game is just much higher on Apple’s devices due to the superior shading and features.
In general, this is one reason while I’m apprehensive of publishing real game benchmarks as it’s just a false comparison and can lead to misleading conclusions. We use specifically designed benchmarks to achieve a “ground truth” in terms of performance, especially in the context of SoCs, GPUs, and architectures.
The A15 continues to cement Apple’s dominance in mobile gaming. We’re looking forward to the next-gen competition, especially RDNA-powered Exynos phones next year, but so far it looks like Apple has an extremely comfortable lead to not have to worry much.
Today’s investigation into the new A15 is just scratching the tip of the iceberg of what Apple has to offer in the new generation iPhone 13 series devices. As we’re still working on the full device review, we got a good glimpse of what the new silicon is able to achieve, and what to expect from the new devices in terms of performance.
On the CPU side of things, Apple’s initial vague presentation of the new A15 improvements could either have resulted in disappointment, or simply a more hidden shift towards power efficiency rather than pure performance. In our extensive testing, we’re elated to see that it was actually mostly an efficiency focus this year, with the new performance cores showcasing adequate performance improvements, while at the same time reducing power consumption, as well as significantly improving energy efficiency.
The efficiency cores of the A15 have also seen massive gains, this time around with Apple mostly investing them back into performance, with the new cores showcasing +23-28% absolute performance improvements, something that isn’t easily identified by popular benchmarking. This large performance increase further helps the SoC improve energy efficiency, and our initial battery life figures of the new 13 series showcase that the chip has a very large part into the vastly longer longevity of the new devices.
In the GPU side, Apple’s peak performance improvements are off the charts, with a combination of a new larger GPU, new architecture, and the larger system cache that helps both performance as well as efficiency.
Apple’s iPhone component design seems to be limiting the SoC from achieving even better results, especially the newer Pro models, however even with that being said and done, Apple remains far above the competition in terms of performance and efficiency.
Overall, while the A15 isn’t the brute force iteration we’ve become used to from Apple in recent years, it very much comes with substantial generational gains that allow it to be a notably better SoC than the A14. In the end, it seems like Apple’s SoC team has executed well after all.
The Apple A15 SoC Performance Review: Faster & More Efficient - AnandTech
Read More


No comments:
Post a Comment